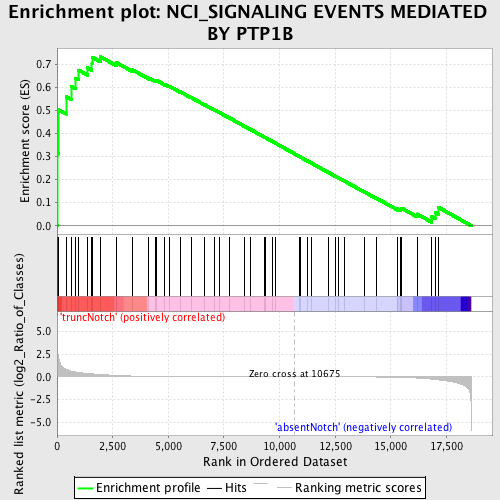
Profile of the Running ES Score & Positions of GeneSet Members on the Rank Ordered List
| Dataset | Set_03_absentNotch_versus_truncNotch.phenotype_absentNotch_versus_truncNotch.cls #truncNotch_versus_absentNotch |
| Phenotype | phenotype_absentNotch_versus_truncNotch.cls#truncNotch_versus_absentNotch |
| Upregulated in class | truncNotch |
| GeneSet | NCI_SIGNALING EVENTS MEDIATED BY PTP1B |
| Enrichment Score (ES) | 0.7311436 |
| Normalized Enrichment Score (NES) | 1.5855948 |
| Nominal p-value | 0.0 |
| FDR q-value | 0.25005403 |
| FWER p-Value | 0.81 |
| PROBE | DESCRIPTION (from dataset) | GENE SYMBOL | GENE_TITLE | RANK IN GENE LIST | RANK METRIC SCORE | RUNNING ES | CORE ENRICHMENT | |
|---|---|---|---|---|---|---|---|---|
| 1 | RHOA | 580142 5900131 5340450 | 18 | 3.530 | 0.3130 | Yes | ||
| 2 | BLK | 1940128 5390053 | 63 | 2.150 | 0.5018 | Yes | ||
| 3 | SOCS3 | 5550563 | 402 | 0.851 | 0.5593 | Yes | ||
| 4 | TYK2 | 1660465 1740736 | 629 | 0.631 | 0.6032 | Yes | ||
| 5 | STAT5A | 2680458 | 831 | 0.525 | 0.6392 | Yes | ||
| 6 | FGR | 3780047 | 977 | 0.470 | 0.6731 | Yes | ||
| 7 | PDGFRB | 6450279 | 1374 | 0.356 | 0.6835 | Yes | ||
| 8 | PTPN1 | 2650056 | 1567 | 0.318 | 0.7015 | Yes | ||
| 9 | CSK | 6350593 | 1570 | 0.318 | 0.7296 | Yes | ||
| 10 | LCK | 3360142 | 1955 | 0.250 | 0.7311 | Yes | ||
| 11 | CAPN1 | 6660300 | 2676 | 0.149 | 0.7056 | No | ||
| 12 | LAT | 3170025 | 3384 | 0.084 | 0.6750 | No | ||
| 13 | EGFR | 4920138 6480521 | 4127 | 0.052 | 0.6397 | No | ||
| 14 | ITGB3 | 5270463 | 4422 | 0.044 | 0.6278 | No | ||
| 15 | CDH2 | 520435 2450451 2760025 6650477 | 4488 | 0.042 | 0.6281 | No | ||
| 16 | BCAR1 | 1340215 | 4846 | 0.035 | 0.6119 | No | ||
| 17 | STAT5B | 6200026 | 5048 | 0.031 | 0.6039 | No | ||
| 18 | INSR | 1190504 | 5526 | 0.024 | 0.5803 | No | ||
| 19 | PRLR | 1980647 1990097 | 6018 | 0.019 | 0.5555 | No | ||
| 20 | HCK | 4230592 | 6640 | 0.014 | 0.5233 | No | ||
| 21 | TRPV6 | 4010717 | 7072 | 0.011 | 0.5011 | No | ||
| 22 | DOK1 | 1050279 2680112 5220273 | 7303 | 0.010 | 0.4896 | No | ||
| 23 | LEPR | 1340398 3190324 | 7737 | 0.008 | 0.4671 | No | ||
| 24 | CAV1 | 870025 | 8419 | 0.006 | 0.4309 | No | ||
| 25 | PIK3R1 | 4730671 | 8693 | 0.005 | 0.4167 | No | ||
| 26 | IRS1 | 1190204 | 9331 | 0.003 | 0.3827 | No | ||
| 27 | YES1 | 6100050 | 9348 | 0.003 | 0.3821 | No | ||
| 28 | ITGA2B | 2680538 | 9678 | 0.002 | 0.3646 | No | ||
| 29 | LYN | 6040600 | 9805 | 0.002 | 0.3581 | No | ||
| 30 | SRC | 580132 | 10877 | -0.001 | 0.3004 | No | ||
| 31 | CRK | 1230162 4780128 | 10920 | -0.001 | 0.2982 | No | ||
| 32 | AKT1 | 5290746 | 11232 | -0.001 | 0.2816 | No | ||
| 33 | SPRY2 | 5860184 | 11446 | -0.002 | 0.2703 | No | ||
| 34 | PRL | 3440435 | 12205 | -0.004 | 0.2299 | No | ||
| 35 | NOX4 | 6040136 | 12517 | -0.006 | 0.2136 | No | ||
| 36 | PIK3CA | 6220129 | 12641 | -0.006 | 0.2075 | No | ||
| 37 | LEP | 4010053 | 12899 | -0.007 | 0.1943 | No | ||
| 38 | FYN | 2100468 4760520 4850687 | 13795 | -0.014 | 0.1474 | No | ||
| 39 | JAK2 | 3780528 6100692 6550577 | 14357 | -0.022 | 0.1191 | No | ||
| 40 | SHC1 | 2900731 3170504 6520537 | 15308 | -0.060 | 0.0732 | No | ||
| 41 | CSF1 | 3120400 | 15437 | -0.068 | 0.0724 | No | ||
| 42 | EGF | 5220154 | 15488 | -0.071 | 0.0760 | No | ||
| 43 | STAT3 | 460040 3710341 | 16182 | -0.137 | 0.0509 | No | ||
| 44 | CSF1R | 2340110 6420408 | 16838 | -0.263 | 0.0390 | No | ||
| 45 | GRB2 | 6650398 | 16989 | -0.299 | 0.0575 | No | ||
| 46 | YBX1 | 1340039 4730500 | 17127 | -0.338 | 0.0802 | No |

